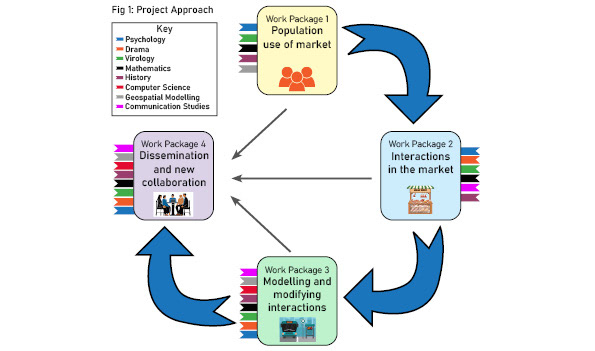
Infographics for Major Competitive UK Research Council Grant (Contain: Contact Tracing, Infection and Transmission: An Interdisciplinary Approach)
I produced the graphic materials for this £1m project (universities of Warwick, Oxford, Southampton, Ghana and Chulalongkorn Thailand). This was ranked in the top 2% of applications nationwide and awarded funding.
-------

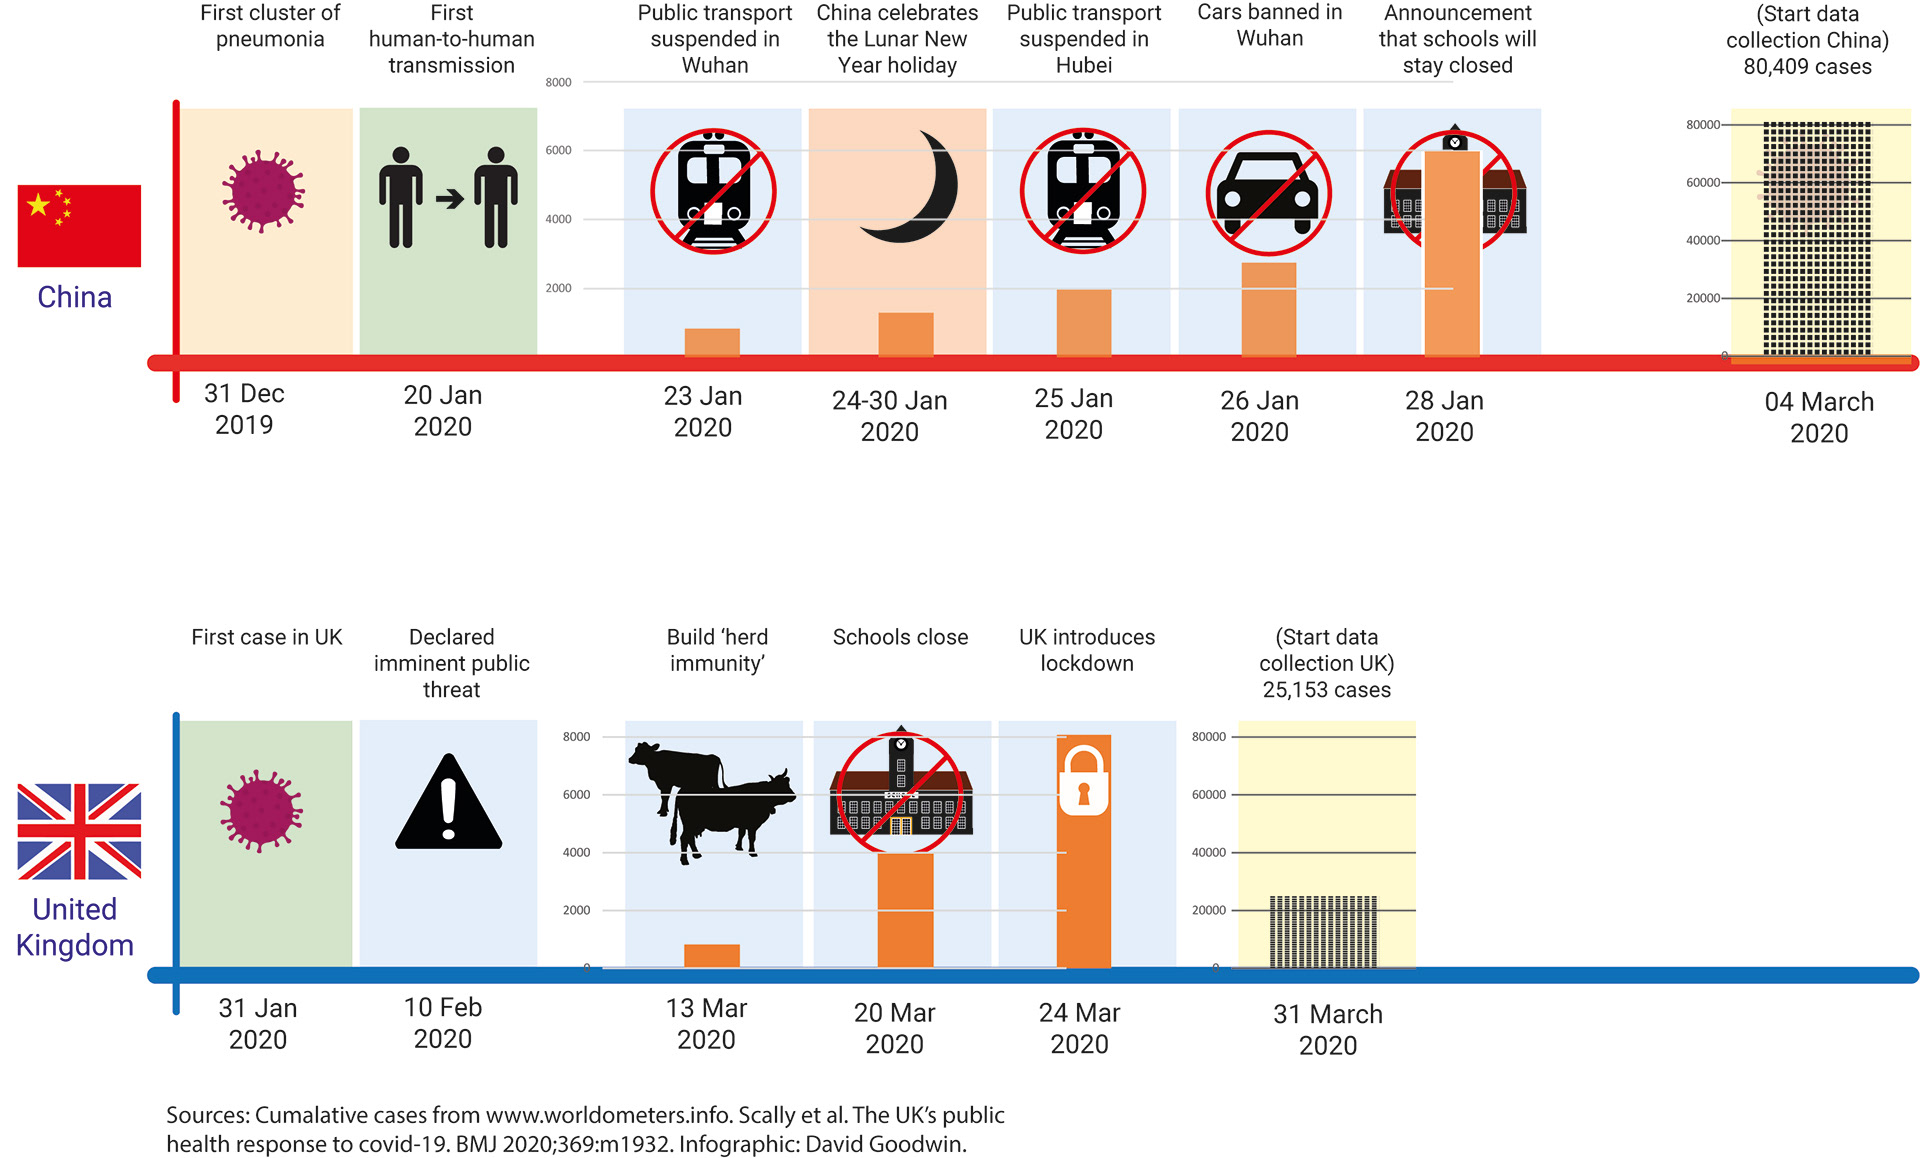
Also in the British Medical Journal, under "Supplemental Material"
I produced graphs detailing the progression of Covid-19 cases from 31st January 2020 through to 22nd June using adobe illustrator cc. These articles included data collected from different studies, incorporating key events during the pandemic.